

Diagramming may be one of the simplest forms of data visualization, yet holds tremendous power in aiding decision making and revealing hidden information from data.
SmartDraw Software, a provider of diagramming software, today announced building momentum of its recently-announced Open API to assist in building applications that generate a diagram from external data. In the 30 days since announcement SmartDraw reports a 22 percent increase in daily unique users, and has had several enterprise customers and system integrators enter into its SmartDraw Open API developer program.
Data visualization software typically takes XY datasets and displays them as a graph. Until recently there has been no data visualization software for non-XY data, such as hierarchical or relational data. SmartDraw released its Open API in early September, allowing developers to use SmartDraw’s Intelligent Formatting Engine to generate virtually any type of diagram from any data source. SmartDraw’s Open API allows developers to build sophisticated data-to-diagram functionality on their own, without any development effort from SmartDraw.
After a multiple year development effort, this API is currently being used in the Atlassian ecosystem to generate Scaled Agile Framework (SAFe) diagrams from Jira data, Jira dependency trees, Confluence space maps and many other diagrams from data stored in these apps. Outside of the ecosystem, it is used to build class diagrams from source code in Github, ER diagrams from SQL databases and sitemaps from Google sitemap XML files.
Example of a PI planning board (SAFe) from Jira data automatically rendered in SmartDraw:
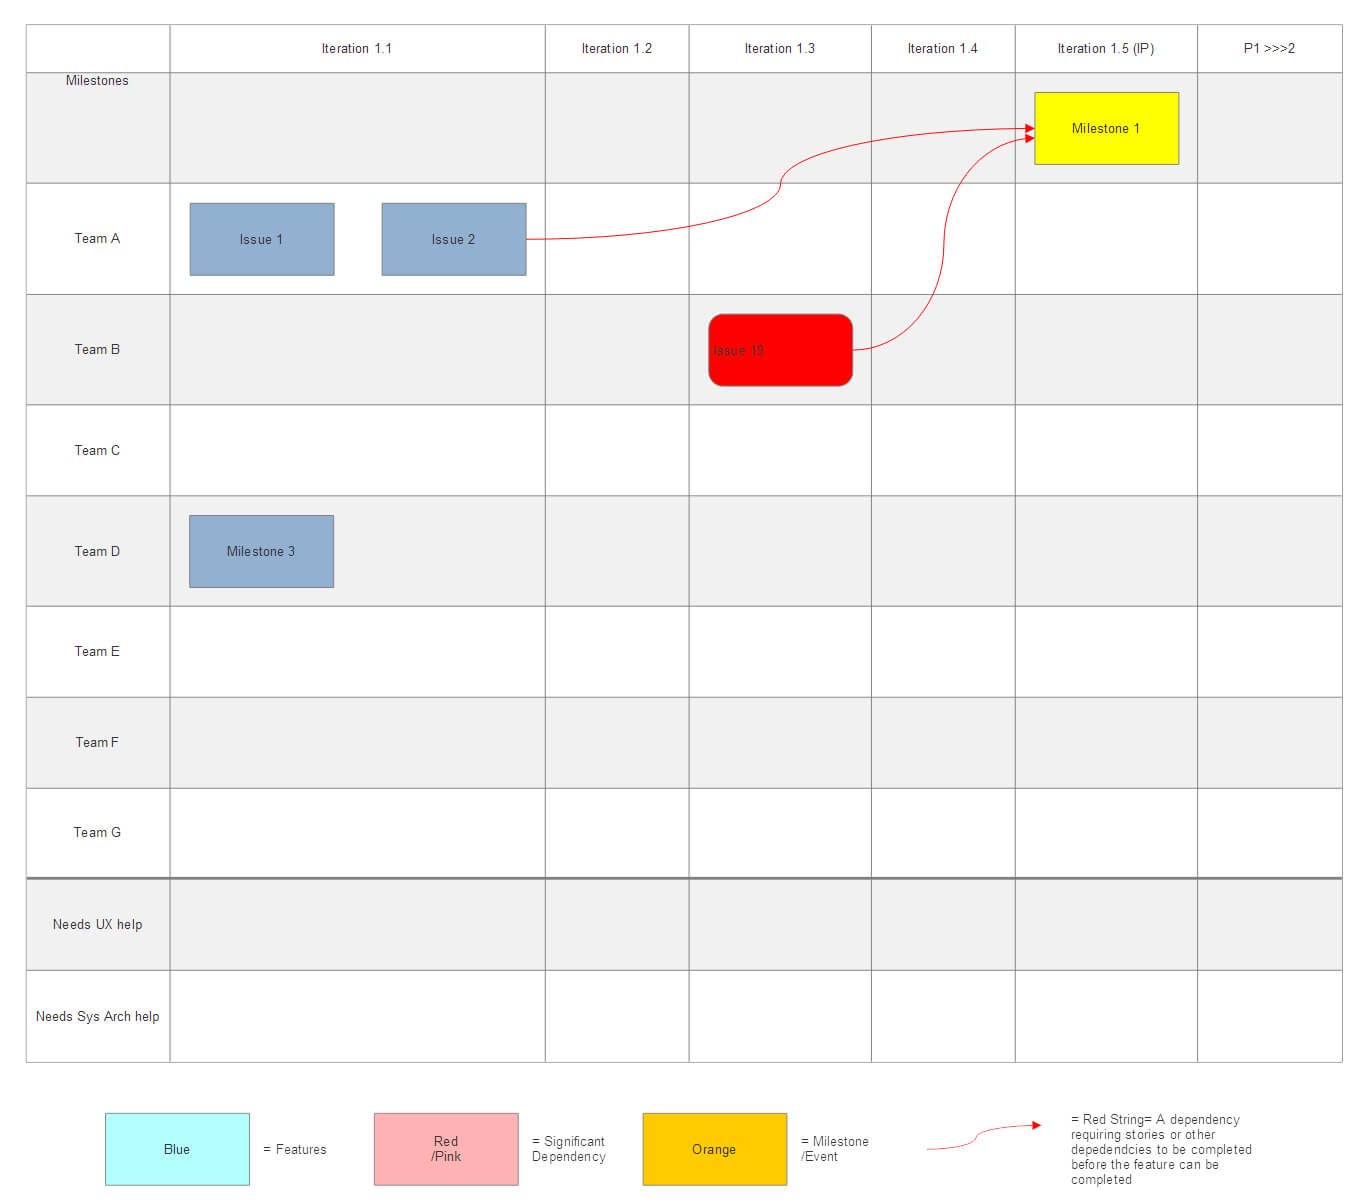
PI PLANNING BOARD created through API from SmartDraw pulling data from Atlassian’s Jira


