

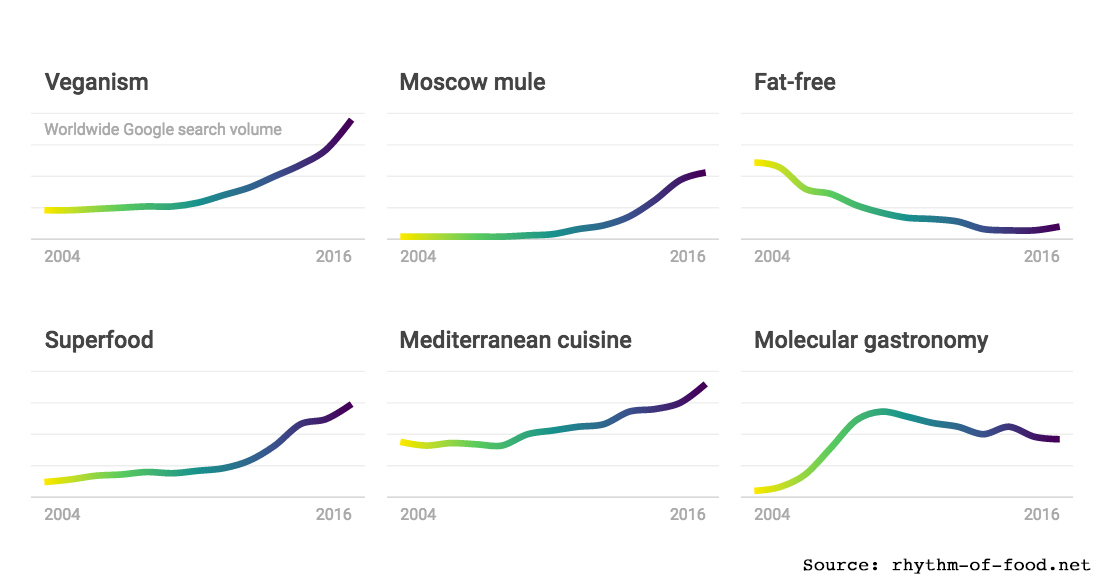
Rhythm of food showing trends in food searches around food and eating themes
Google News Labs and Truth & Beauty teamed up to produce an interactive data visualization called The Rhythm of Food. Worthy of FiveThirtyEight or New York Times’ interactive DataViz Journalism, the foundational information comes from Google Search Trends, a rich source of data points about the interest people have in not just finding a great restaurant, but burrowing down to the individual ingredients in everything from ordinary daily fare to holiday customs that affect consumption of raw consumables. The searches used as source data span 2004 through 2016, as of the writing of this article.
Along with writers, speakers and highly regarded data visualization experts Alberto Cairo, (The Functional Art) and Simon Rogers, the project’s graphic/visualization lead is “Information is Beautiful” award-winner Moritz Stefaner (see our article on his OECD Data Portal).
The site currently posts that “It’s December! What’s asked for right now?”, and shows a variety of foods (mostly prepared, including tamales and chocolate chip cookies) and the patterns of google searches with those terms, worldwide.
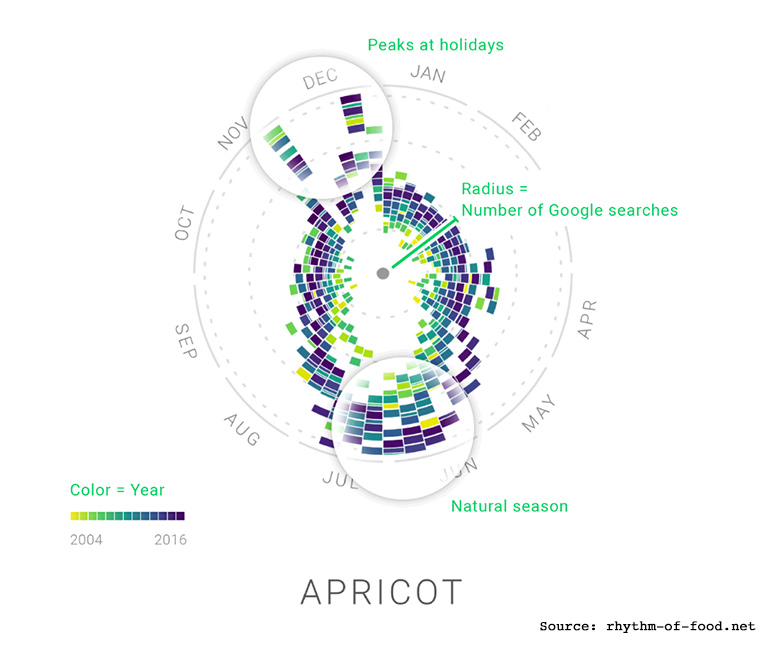
Explanatory graphic of annual cycles of searches: showing here a demonstration of searches for APRICOT, with explanatory notes
Other queries are shown for raw foods, such as apples and asparagus, with some notations on spikes around holidays with symbolic meanings to foods that are highly consumed on specific times.
Explore the site with its full interactivity at: http://rhythm-of-food.net


